Creates dots in an axes and returns handles of the dots.
Syntax
h = scatter(x, y)
h = scatter(x, y, size)
h = scatter(x, y, size, cdata)
h = scatter(..., color)
h = scatter(..., style)
h = scatter(..., property, value, ...)
h = scatter(hAxes, ...)
Inputs
x,y
Range of the x and y axes.
Type: double | integer
Dimension: scalar | vector | matrix
size
Size of the scattered dots. Can be either a scalar, setting the same size for each
dot, or a matrix, setting the size of each dot.
Type: integer
Dimension: scalar | vector
cdata
An Mx3 matrix that defines the color of each scattered dot.
Type: double | integer
Dimension: matrix
color
Color of the scattered dots.
Type: double | integer | string
Dimension: scalar | vector
style
Style of the scattered dots.
Type: char
Dimension: scalar
property
Properties that control the appearance or behavior of the graphics object.
Type: string
Dimension: scalar
value
Value of the properties.
Type: double | integer | string
Dimension: scalar | vector
hAxes
Axis handle. .
Type: double
Dimension: scalar
Outputs
h
Handle of the scatter graphics object.
Examples
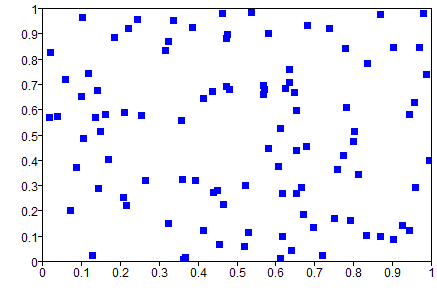
Simple scatter
example:
clf;
x = rand(1, 100);
y = rand(1, 100);
s = scatter (x, y);
Figure 1. Scatter plot
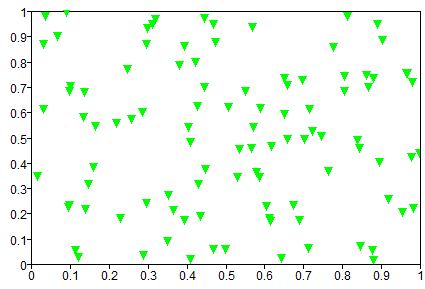
Simple scatter example with size color and filled
option:
clf;
x = rand(1, 100);
y = rand(1, 100);
s = scatter (x, y, 10, 'gv', 'filled');
Figure 2. Scatter plot with options
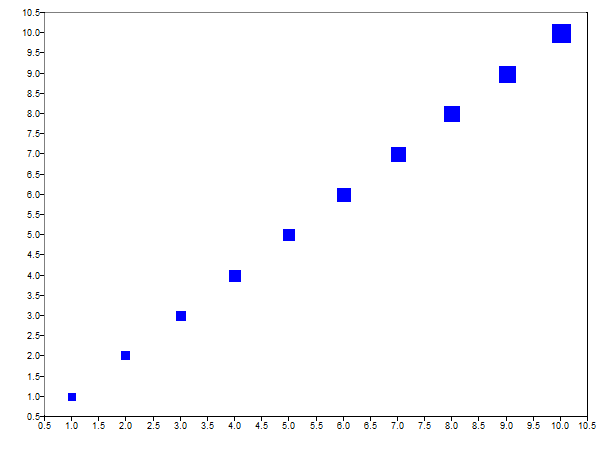
Set the size of each scatter dot:
clf;
s = scatter(1:10,1:10, 1:10)
Figure 3. Scatter plot size
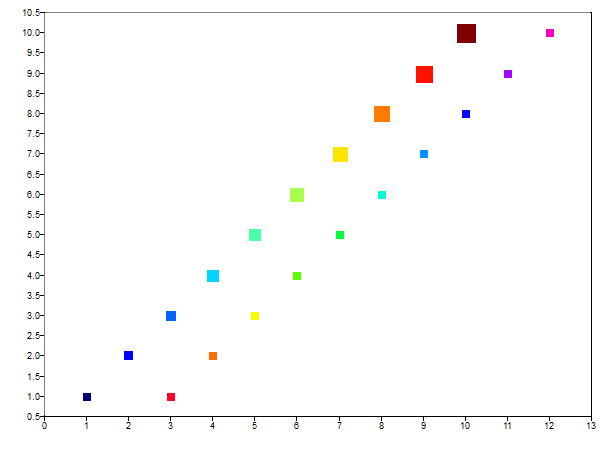
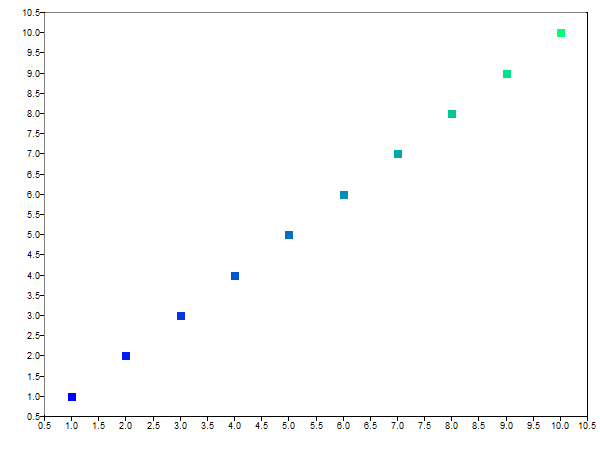
Set the color of each scatter dot:
clf;
s1 = scatter(1:10,1:10,1:10, jet(10));
hold on
% the size may be ignored
s1 = scatter(3:12,1:10,[], rainbow(10));
Figure 4. Scatter plot color
In case a single color is set for all dots, keyword 'flat' may be used to set back the
cdata dot color:
clf;
s = scatter(1:10,1:10);
% set the cdata
set(s,'cdata',winter(10));
% set the color of all dots to red
set(s,'markerfacecolor','r');
% set the color to 'cdata'
set(s,'markerfacecolor','flat');
Figure 5. Set markerfacecolor to 'flat'
Comments
If there is no axis, one will be created first. It takes optional arguments to control the
dots style. It can be either the size of the dots (not supported yet), the color of the dots
(not supported yet), the style of the dots, filled (not supported yet), property/value
pairs, or all of them. If the first argument of scatter() is an axis
handle, lines are created in that axis.