triplot

Creates a 2D triangulated mesh.

Syntax

h = triplot(tri, x, y)

h = triplot(tri, x, y, fmt)

h = triplot(..., property, value, ...)

h = triplot(hAxes, ...)

Inputs

tri
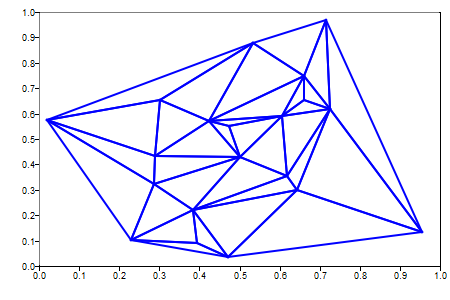
An Mx3 matrix, where M is the number of triangles. Each row contains the indices of a triangle in the x and y matrices. Usually, tri is the output of the delaunay function.
Type: integer
Dimension: vector | matrix
x, y
Coordinates of the vertices.
Type: double | integer
Dimension: vector | matrix
fmt
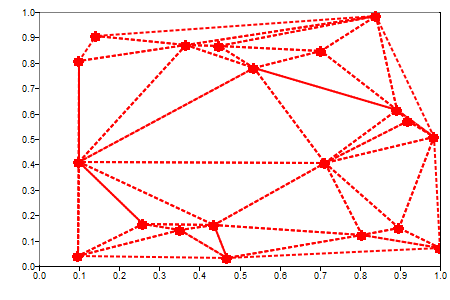
Formatting string for the curve. It can be any combination of the following strings:
  1. line style: '-', '-.', ':', '--', '-:'.
  2. line color: 'r', 'g', 'b', 'c', 'y', 'm', 'w', 'k'.
  3. marker style: 's', 'o', 'd', 'x', 'v', '^', '+', '*', '.'.
Type: string
Dimension: scalar
property
Properties that control the appearance or behavior of the graphics object.
Type: string
Dimension: scalar
value
Value of the properties.
Type: double | integer | string
Dimension: scalar | vector
hAxes
Axis handle.
Type: double
Dimension: scalar

Outputs

h
Handle of the triplot graphics object.

Examples

Simple triplot example:
N = 20;
x = rand (N, 1);
y = rand (N, 1);
tri = delaunay (x, y);

figure;
h = triplot (tri, x, y);


Figure 1. Simple triplot example
Set line style in triplot:
N = 20;
x = rand (N, 1);
y = rand (N, 1);
tri = delaunay (x, y);

figure;
h = triplot (tri, x, y, 'r:o');


Figure 2. triplot line style

Comments

If there are no axes, they will be created first.